A new year has brought some significant changes to our household. First, I wanted to post that I have joined DataRobot this January as a data scientist. The DataRobot platform is a game-changing piece of technology. Providing a complete end-to-end platform that can take AI from an idea into production …
Articles by Luke Shulman
-
Now reading Vitner's Luck by Elizabeth Knox📙 I am not sure how Lisa See does it but her books (i have read two) are amazingly engrossing. This one ran long but still lingers with me weeks later.
-
Now reading Gideon the ninth by tamryn Muir📙 Amazing and fun.
Summer Updates
Where are all the posts
-
Lilith's Brood Trilogy by Octavia Butler📙 Amazing work of science fiction
-
One Day in December by Josie Silver📙 Will certainly be a NetFlix Rom Com movie.
-
American Rust by Pillip Meyer📙 Adding Audio Files for my Daily Commute
Getting audio from YouTube for my daily commute.
-
Now reading the Lies of Locke Lamora by Scott Lynch📙 Swash-buckling in the economy of thieves
Role of Randomness
Randomness is a very underrated tool in data visualizations. The reason we respond to charts is because the human mind is so good at spatial pattern recognition. But if we are looking specifically for patterns, what role does randomness play in exposing patterns?
Consider the following use case using data from Star Wars API
Scaling Data
Scaling data is a constant challenge in analytics projects. Whether to get a visualization to fit on screen or to take a independent variable and remove outliers scaling transforms data from working in one domain or another.
Let's think about this by example, let's say you wanted to analyze the US Government budget. You would find that the US Federal government spends about \$2 Billion on deposit insurance and \\$1 Trillion on Medicare. A huge range. But what if we wanted to know about what share that would be if the US National budget were only \$100.
now reading The Golden State by Ben Winters📙 Great dystopian noir.
Layering Maps and Data?
At Algorex Health, we make a lot of maps and get a lot of questions about the tools we use to make them. So, I thought I would briefly describe our process and the tools we use. I covered the basics of geographic charting in a past blog post and some of that terminology will be repeated here.
Solving Problems
One of my first consulting projects was working on the call center software for a large health insurer. The client was implementing a massive core system replacement and various satellite applications, lie the call center software, needed to retrofitted to call data from both. As this was the early 2000s …
OpenElections
My open source contribution for the week of March 4 was to the OpenElections dataset
now reading The Incendiaries by R.O. Kwon📙 Thanks @d_lazarin for the suggestion.
Who is going to Orlando?
This week the health world turns to Orlando for the annual conference of the Health Information Management Systems Society annual conference. it is absolutely one of the biggest events in health IT and one of the top 25 trade shows in the entire country.
How many people attend HIMSS each year? We could search one of hundreds of press releases about the event from exhibitors. We could visit the link above from Trade Show news.
Using Applescript
A light dabble in automation with Applescript.
Now reading Lilith's Brood by Octavia Butler📙 This one book weaves together so much about groupthink, knowledge, and destiny. Has been great so far.
Calculating Obesity from FHIR Data
When parents bring their kids to the pediatrician, one of the most important checks is to have the childs heigh, weight, and BMI plotted on growth charts to understand their development. The charts, a screen of which appears below, are ubiquitious.
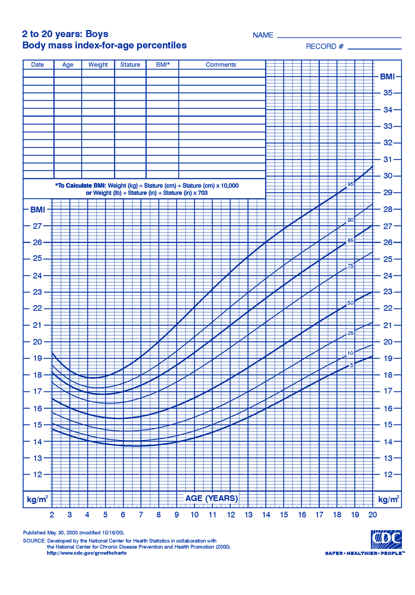
Sure enough, many many EHRs automatically show the graph and the patient's position on the chart right there making it easy for physicians and patients to review. They included automated features to measure growth velocity etc. However while the EHR stores the BMI, height, and weight measurements, Most systems do not store the comparative measure of those values for the child's age. This leaves analysts and data scientists in a tricky position when it comes to estimating obesity. How do we identify children who may be obese absent this information?
Now reading Snow Flower and the Secret Fan by Lisa See📙 I am not sure how Lisa See does it but her books (i have read two) are amazingly engrossing. This one ran long but still lingers with me weeks later.
Now reading Bring up the Bodies by Hilary Mantel📙 After about 10 months on the waiting list, I finally got Hillary Mantel's amazing sequel in the Thomas Cromwell series.
Welcome
Welcome Post On Learning Programming and Developing a Data Science Career
Now reading the Necessary Death of Lewis Winter by Malcom MacKay📙 Really cool crime book taking place in Scotland. Each character instantly recognizable excited for sequel.