Air Travel and the Median Income of Surronding Communities
What’s it for?
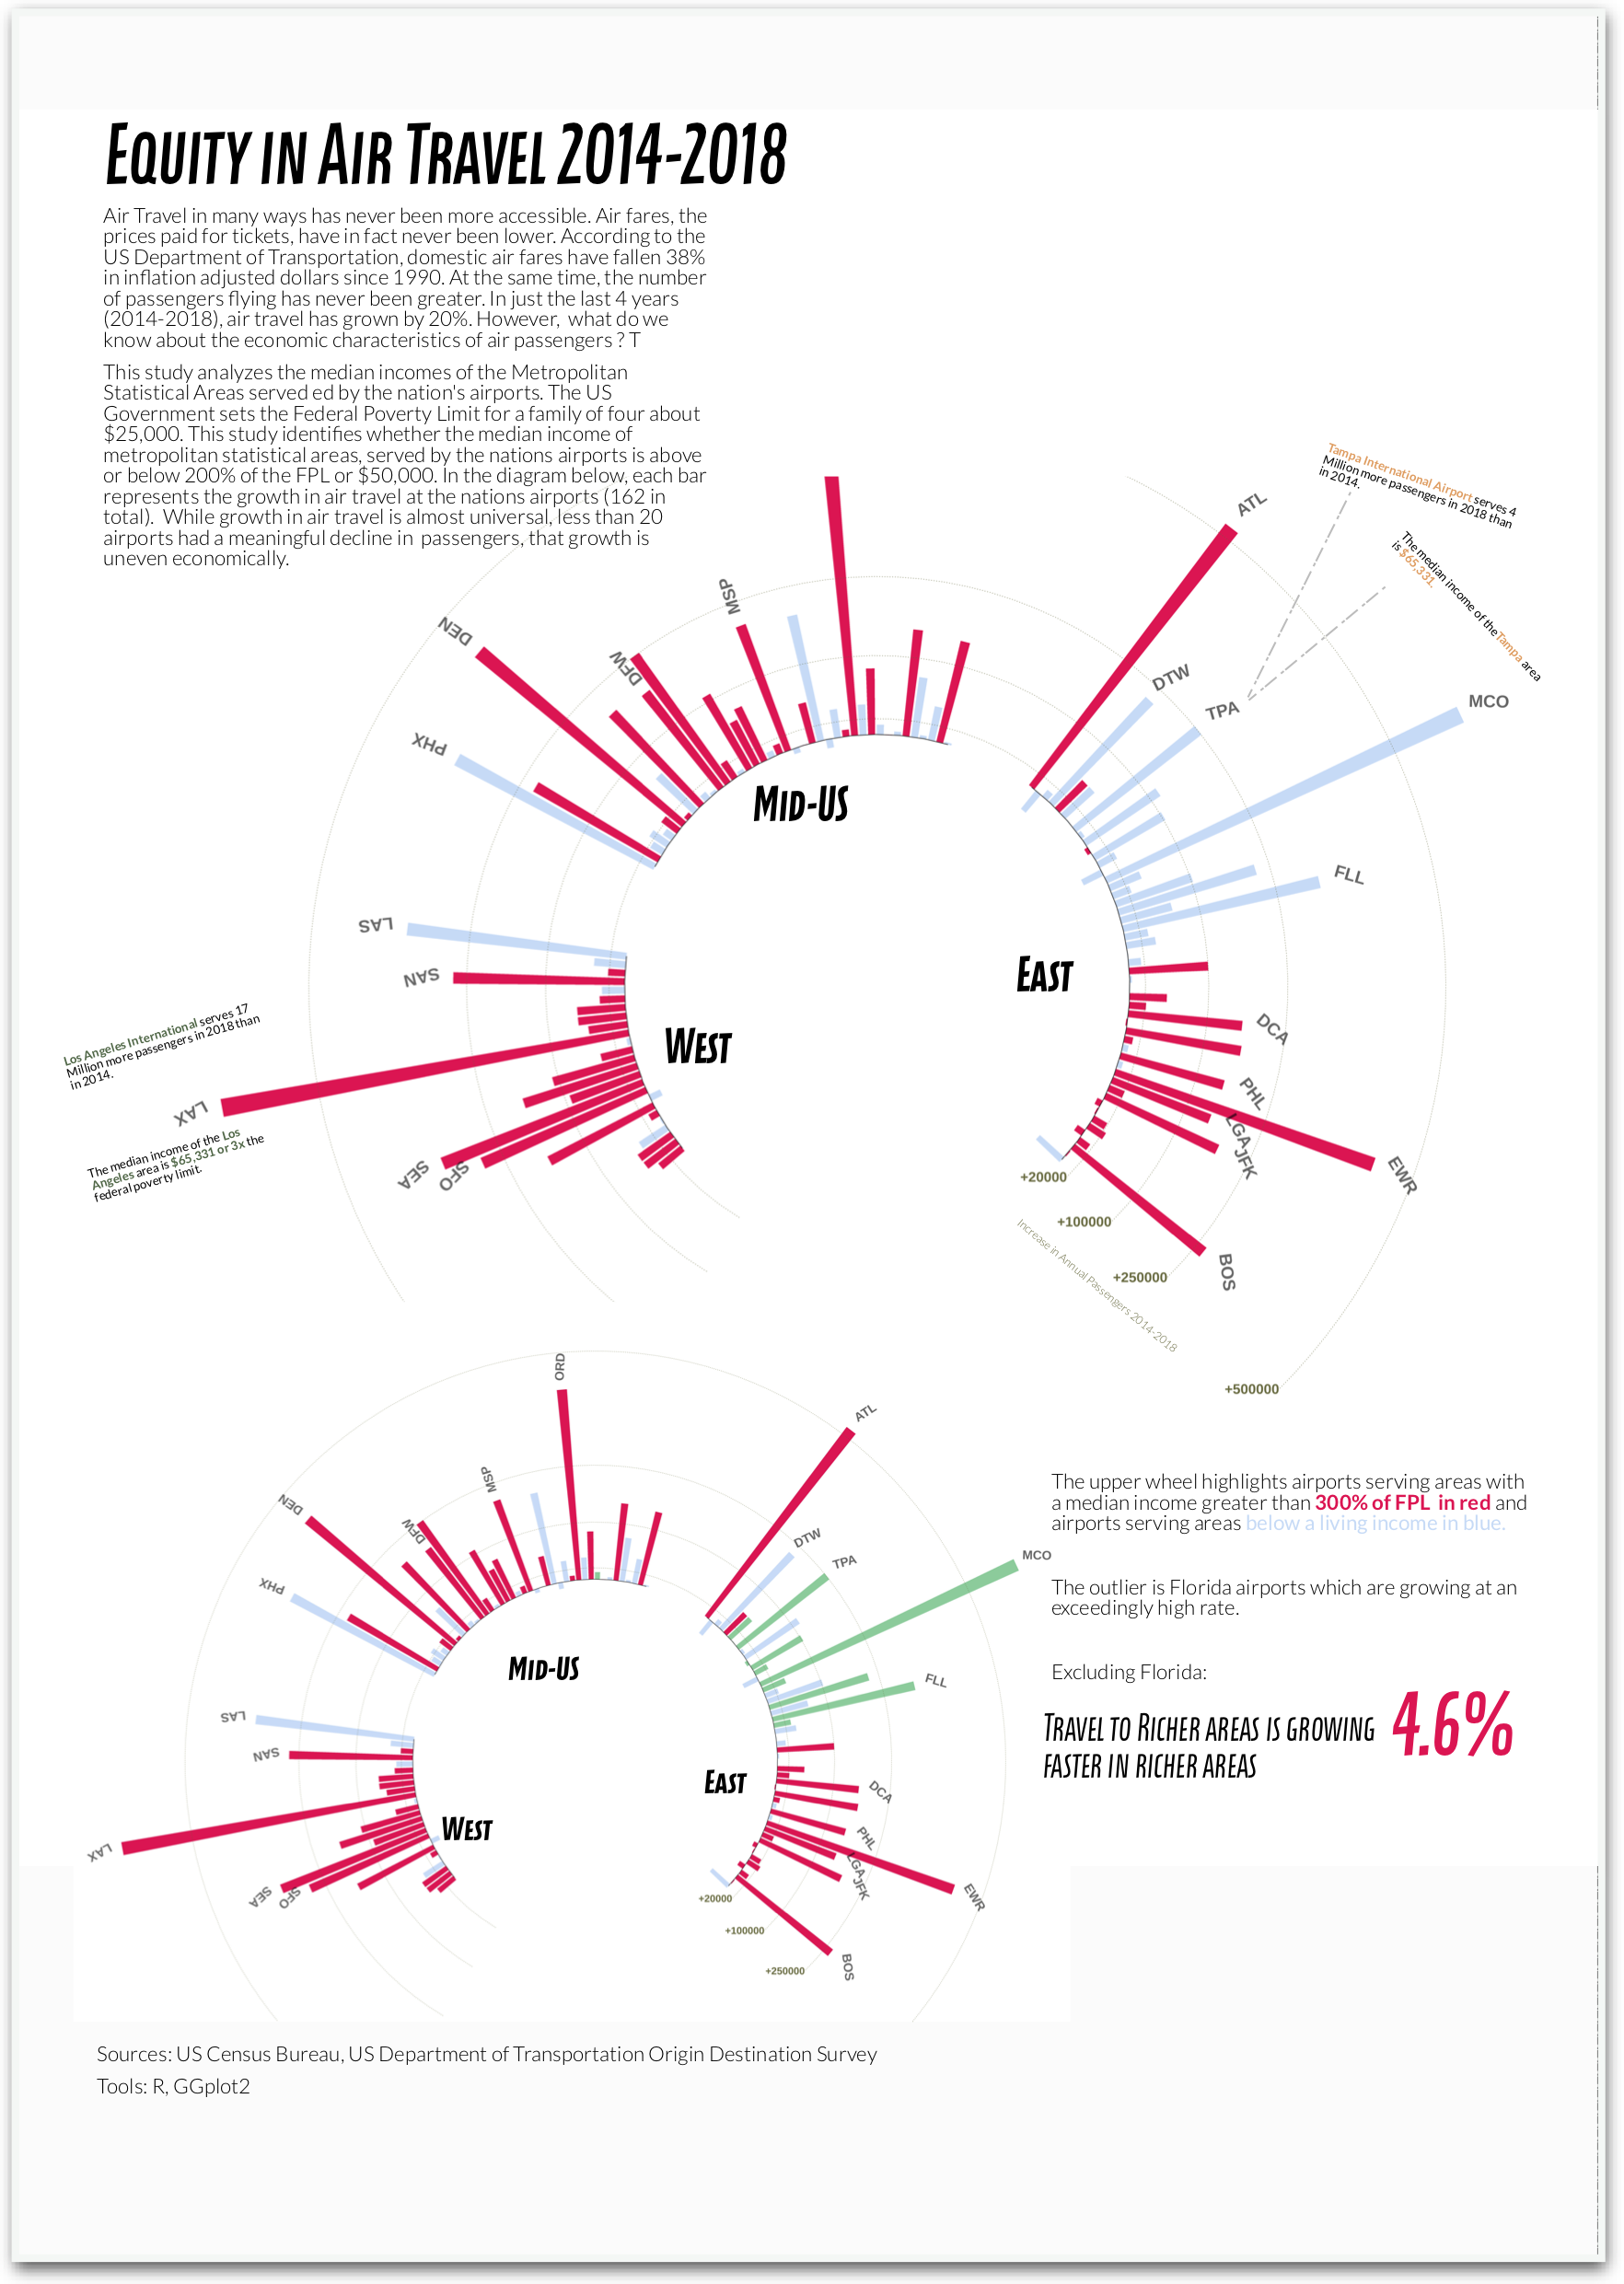
Showcase big-data techniques processing over 100 million passenger tickets to identify the economic effects of air travel
What is it doing?
Comparing the rise in air travel from richer areas to poorer areas
How was it received?
Awaiting publication
Tools used
Python, Dask, R, GGplot2
Last updated: Wed 27 February 2019